System Description
Scale track-vehicle models were used in the past to investigate the ballast degradation or to test newly developed algorithms for the determination of the track quality through the measured acceleration.
For real tracks, irregularities are generally detected by special track recording vehicles, which measure the track geometry parameters (gauge, horizontal and vertical alignments). However, these vehicles are expensive to acquire and to operate. Therefore, the number of Vehicles is limited and continuous monitoring of a complete rail network in a short period of time is not possible. Also, track recording vehicles may interrupt regular operation. Depending on the recorded data, the evaluation of irregularities is based on a discrete failure analysis with defined tolerances and limit values. The determination of a specific failure type and its exact position is in the most cases very difficult.
Therefore, the big advantage of the scale model is that the characteristic of the different failure types and their exact position are well known in the model and in the measured acceleration signal. As a result, the definition of different patterns in the measured accelerations is relatively simple. Furthermore, developed algorithms and methods can easily be tested.
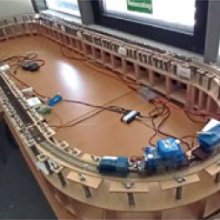
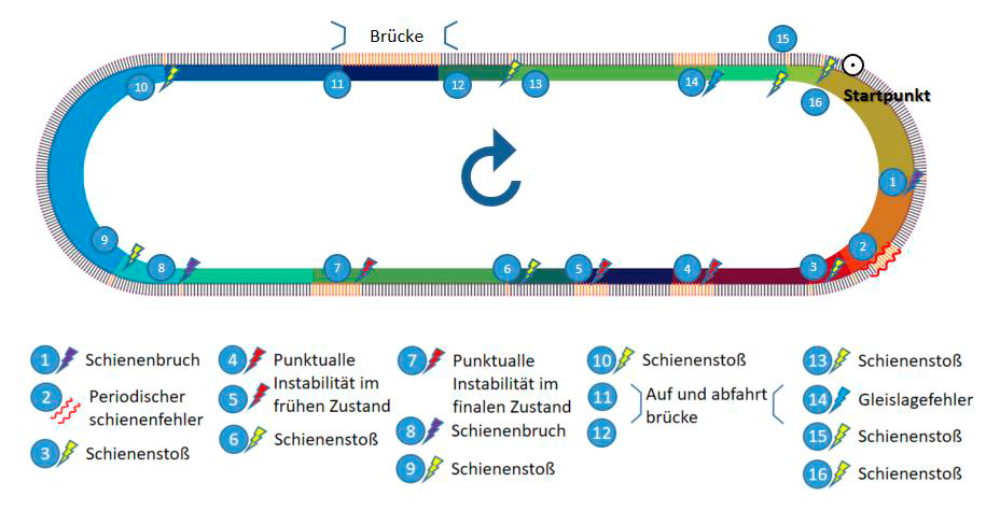
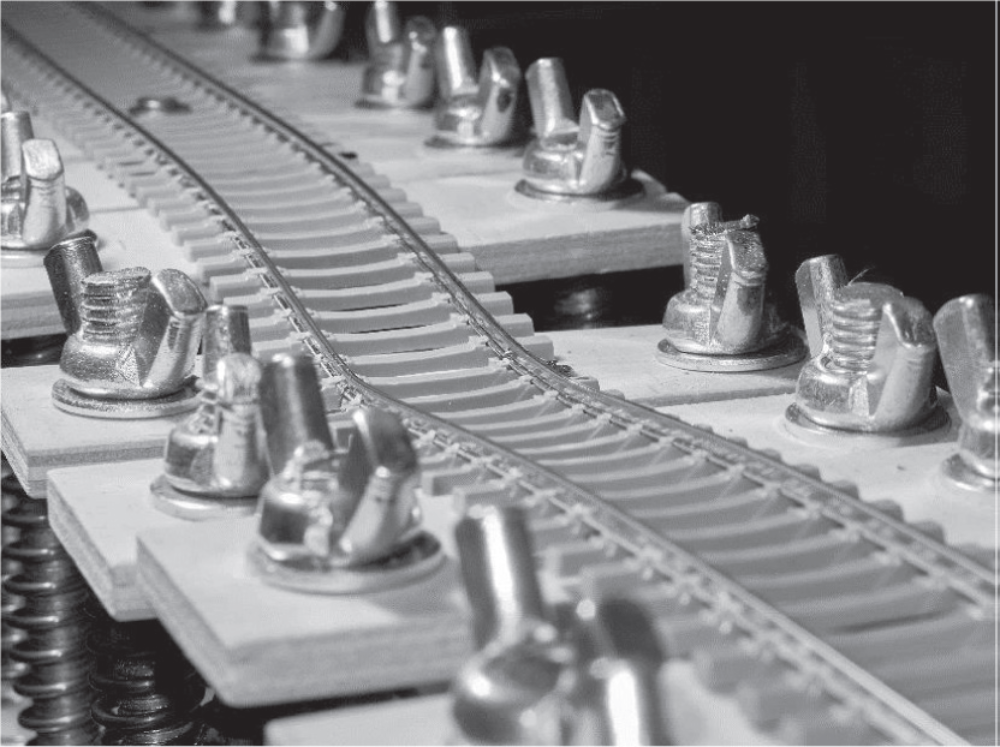
Our laboratory track-vehicle scale model was built to generate different track defects and the associated acceleration and / or gyro signals measured from the model vehicle. The model is built on a scale of 1:87 (scale model: real system) and forms an oval structure with two curves and two tangents. The length of one lap is 6.04 m. A special spring-screw construction allows generating different failures (i.e. track irregularities in the vertical direction). By now, 16 fault spots were implemented in the model and based on this, different algorithms were developed to identify faults through the data from quasi-continuously monitoring.
The measurement system consists of one locomotive and two cars. The locomotive pushes the cars with a constant speed of 0.37 m/s, starting and stopping at a chosen point. The first car (low floor car PIKO H0 without springs and dampers) is equipped with the measuring equipment (i.e. a three-axle MEMS accelerometer) and a wireless module connected to a USB port in a PC.
Reference: https://doi.org/10.1016/j.trgeo.2019.01.001
Related research projects
- Determination of the characteristics of punctual instabilities considering the occurring cause and load (EPIB 1.1)
- Funded by the Deutsche Forschungsgemeinschaft (DFG)
- Project duration: 11.2017 – 04.2020
- Efficient Sensor-based Condition Monitoring Methodology for the Detection and Localization of Faults on the Railway Track (ConMoRAIL)
- Funded by the Deutsche Forschungsgemeinschaft (DFG)
- In collaboration with IIGS https://www.iigs.uni-stuttgart.de/
- Project duration: 05.2023 – 04.2026
Contact:

Héctor Alberto Fernández Bobadilla
M. Eng.Akademischer Mitarbeiter, Doktorand